
As the U.S. presidential election approaches, it’s worth examining how past elections have influenced Bitcoin’s price. Historically, the U.S. stock market has shown notable trends around election periods. Given Bitcoin’s correlation with equities and, most notably, the S&P 500, these trends could offer insights into what might happen next.
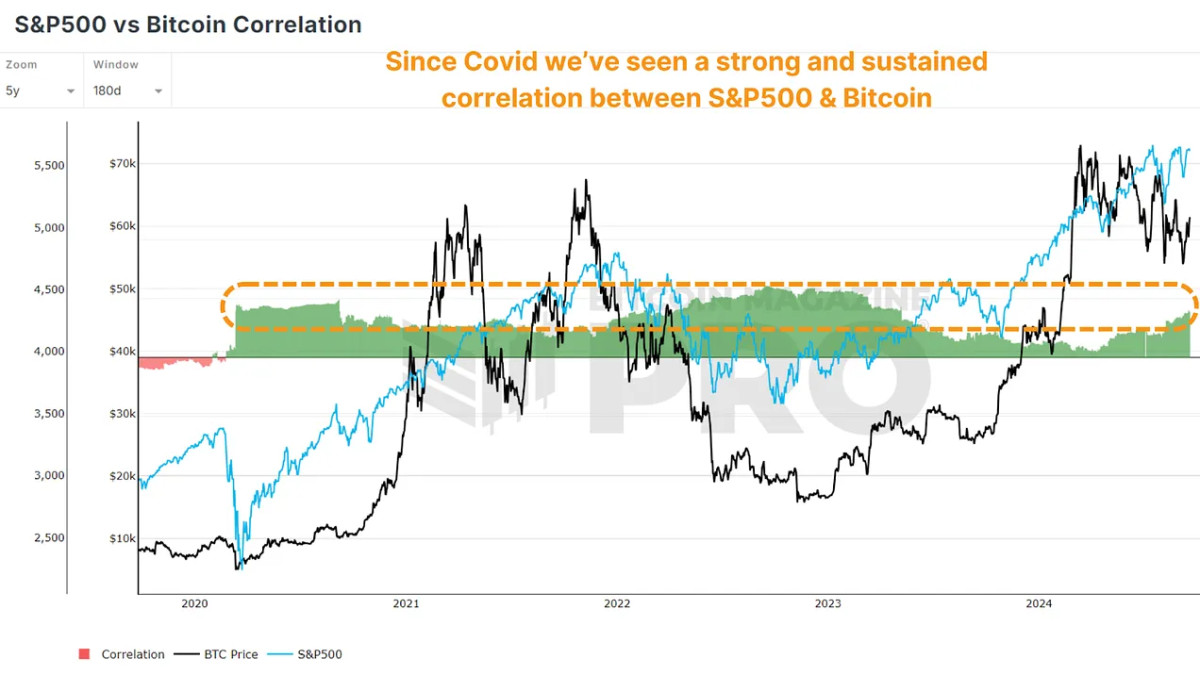
S&P 500 Correlation
Bitcoin and the S&P 500 have historically held a strong correlation, particularly during BTC’s bull cycles and periods of a risk-on sentiment throughout traditional markets. This could phenomenon could potentially come to an end as Bitcoin matures and ‘decouples’ from equities and it’s narrative as a speculative asset. However there’s no evidence yet that this is the case.

Post Election Outperformance
The S&P 500 has typically reacted positively following U.S. presidential elections. This pattern has been consistent over the past few decades, with the stock market often experiencing significant gains in the year following an election. In the S&P500 vs Bitcoin YoY Change chart we can see when elections occur (orange circles), and the price action of BTC (black line) and the S&P 500 (blue line) in the months that follow.
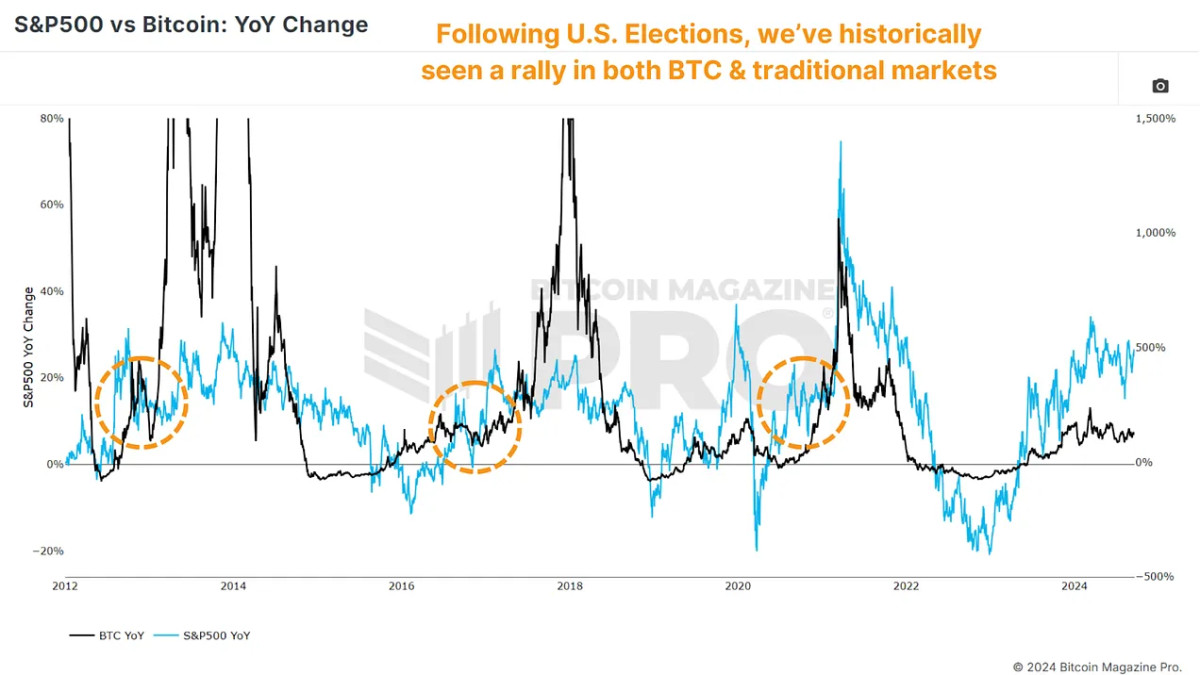
2012 Election: In November 2012, the S&P 500 saw 11% year-on-year growth. A year later, this growth surged to around 32%, reflecting a strong post-election market rally.
2016 Election: In November 2016, the S&P 500 was up by about 7% year-on-year. A year later, it had increased by approximately 22%, again showing a substantial post-election boost.
2020 Election: The pattern continued in 2020. The S&P 500’s growth was around 17-18% in November 2020; by the following year, it had climbed to nearly 29%.
A Recent Phenomenon?
This isn’t limited to the previous three elections while Bitcoin existed. To get a larger data set, we can look at the previous four decades, or ten elections, of S&P 500 returns. Only one year had negative returns twelve months following election day (2000, as the dot-com bubble burst).
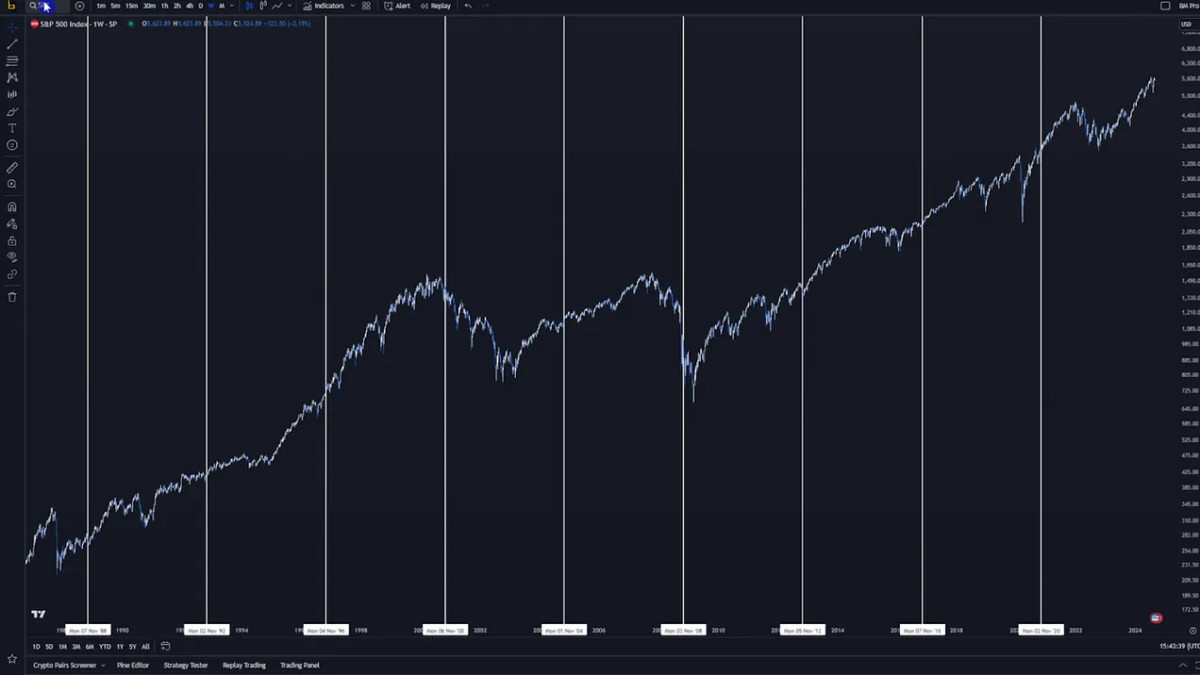
Historical data suggests that whether Republican or Democrat, the winning party doesn’t significantly impact these positive market trends. Instead, the upward momentum is more about resolving uncertainty and boosting investor confidence.
How Will Bitcoin React This Time
As we approach the 2024 U.S. presidential election, it’s tempting to speculate on Bitcoin’s potential performance. If historical trends hold, we could see significant price increases. For example:
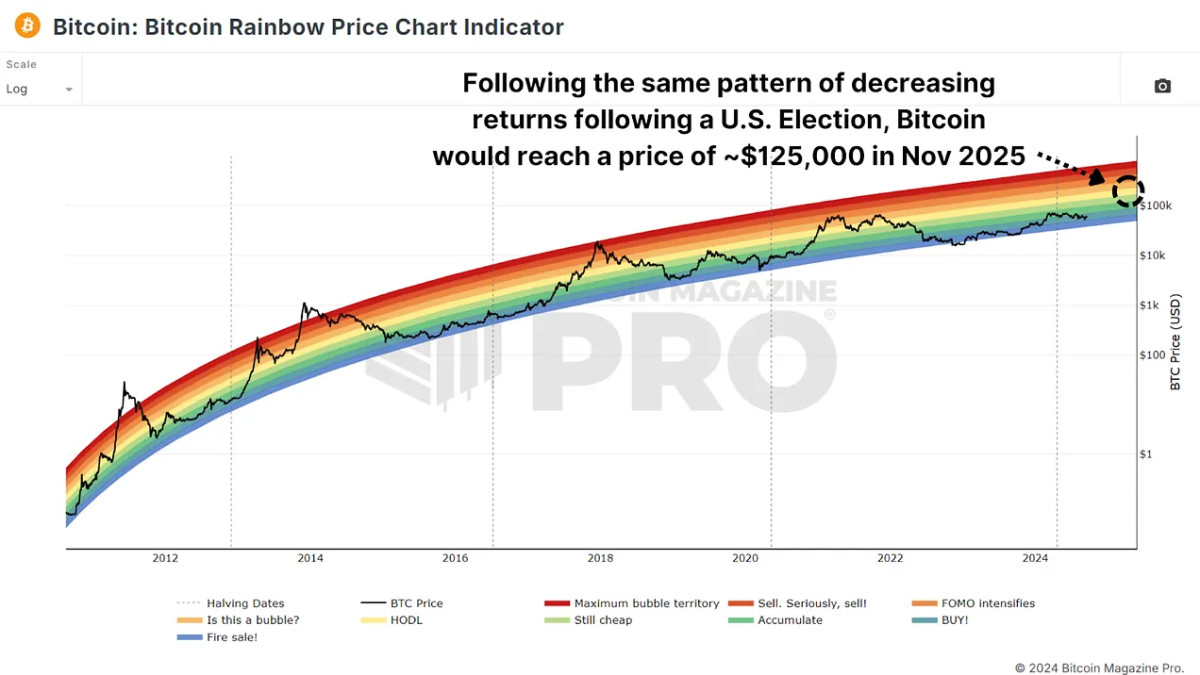
If we experience the same percentage gains in the 365 days following the election as we did in 2012, Bitcoin’s price could rise to $1,000,000 or more. If we experience the same as the 2016 election, we could climb to around $500,000, and something similar to 2020 could see a $250,000 BTC.
It’s interesting to note that each occurrence has resulted in returns decreasing by about 50% each time, so maybe $125,000 is a realistic target for November 2025, especially as that price and data align with the middle bands of the Rainbow Price Chart. It’s also worth noting that in all of those cycles, Bitcoin actually went on to experience even higher cycle peak gains!
Conclusion
The data suggests that the period after a U.S. presidential election is generally bullish for both the stock market and Bitcoin. With less than two months until the next election, Bitcoin investors may have reason to be optimistic about the months ahead.
For a more in-depth look into this topic, check out a recent YouTube video here: Will The U.S. Election Be Bullish For Bitcoin?
#Bitcoin #React #U.S #Election